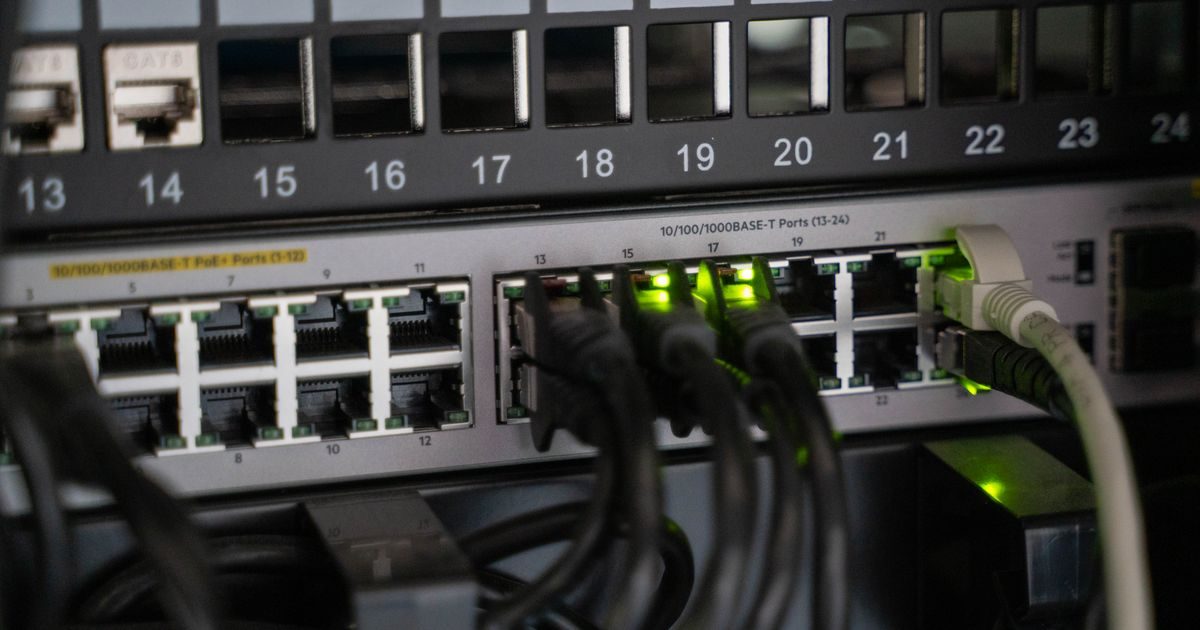
Your VPS server logs are its black box: they record every web request, every SSH login attempt, every database error, and every service that fails silently. Reviewing them regularly lets you catch problems before they become outages or security breaches.
This guide shows you where the most important logs live on a Linux VPS, what information each one contains, and how to read them with concrete commands.
Where Your VPS Main Logs Are Located
On most Linux distributions (Ubuntu, Debian, CentOS, AlmaLinux), system logs are stored under /var/log/. These are the most relevant ones for a web administrator:
| Log file | What it records | When to check it |
|---|---|---|
/var/log/auth.log (Debian/Ubuntu)/var/log/secure (CentOS/RHEL) |
SSH logins, sudo usage, failed attempts | Daily; mandatory if you suspect an intrusion |
/var/log/syslog / /var/log/messages |
General system activity, kernel, services | When a service crashes or the system behaves oddly |
/var/log/apache2/access.log/var/log/nginx/access.log |
Every HTTP request to the web server | For traffic analysis, tracking 4xx/5xx errors |
/var/log/apache2/error.log/var/log/nginx/error.log |
Web server errors (PHP, permissions, timeouts) | Whenever you see a 500 error or blank page |
/var/log/mysql/error.log |
MySQL/MariaDB errors, startup issues, slow queries | When the database is slow or fails to start |
/var/log/fail2ban.log |
IPs blocked by Fail2ban | To review active brute-force attacks |
Essential Commands to Read Logs
You do not need complex tools to get started. These basic commands cover 80% of use cases.
View the latest lines in real time
# Last 50 lines of the Apache error log
tail -n 50 /var/log/apache2/error.log

# Live tail (Ctrl+C to exit)
tail -f /var/log/apache2/access.log
Search for specific patterns with grep
# All 500 errors from today in the Nginx access log
grep " 500 " /var/log/nginx/access.log | grep "$(date +%d/%b/%Y)"

# Failed SSH login attempts
grep "Failed password" /var/log/auth.log | tail -30

# IPs with the most failed attempts
grep "Failed password" /var/log/auth.log | awk '{print $(NF-3)}' | sort | uniq -c | sort -rn | head -10
Analyze compressed (rotated) logs
# Logs rotate and compress; use zgrep to search inside .gz files
zgrep "500" /var/log/nginx/access.log.1.gz
What to Look for in Each Log Type
Web access logs (access.log)
Each line follows the format: IP - - [date] "METHOD /path HTTP/version" status_code bytes.
Alert patterns to watch for:
- Many sequential 404 errors from the same IP: likely a vulnerability scanner.
- 403 errors on sensitive files (
.env,wp-config.php,/etc/passwd): exploitation attempt. - Sudden traffic spikes: DDoS, bot attack, or content that went viral.
- Suspicious payloads in the URL (
../,UNION SELECT,<script>): LFI, SQLi, or XSS attempts.
# Top 10 IPs by request count
awk '{print $1}' /var/log/nginx/access.log | sort | uniq -c | sort -rn | head -10

# All paths that returned 403
grep " 403 " /var/log/nginx/access.log | awk '{print $7}' | sort | uniq -c | sort -rn | head -20
Web error logs (error.log)
This is where real problems surface: PHP errors, permission denials, FastCGI timeouts, failing modules.
# PHP errors in Apache log
grep "PHP" /var/log/apache2/error.log | tail -20

# PHP-FPM upstream timeouts
grep "upstream timed out" /var/log/nginx/error.log | tail -20
Authentication log (auth.log)
This is the first log to check whenever you suspect unauthorized access.
# Successful SSH logins (who got in and from where)
grep "Accepted" /var/log/auth.log | tail -20

# Sudo sessions opened
grep "sudo" /var/log/auth.log | grep "COMMAND" | tail -20
If you see successful logins from IPs you do not recognize, your server has been compromised. Browse the VPS security resources in our guide center for immediate next steps.
Tools for More Advanced Analysis
When logs grow large and manual reading becomes unmanageable, these free tools help.
- GoAccess: real-time visual web log analyzer, directly in the terminal or as an HTML report.
apt install goaccess - Logwatch: generates daily system activity summaries and emails them to you.
apt install logwatch - Fail2ban: not just an IP blocker — its logs give useful insight into active attack patterns.
- Journalctl: on systemd-based distros, centralizes all service logs in one place.
# View logs for a specific service with journalctl
journalctl -u nginx --since "1 hour ago"

# Visual access log summary with GoAccess
goaccess /var/log/nginx/access.log --log-format=COMBINED
For projects needing long-term retention and historical analysis, tools like Elasticsearch + Kibana (the ELK stack) or Grafana Loki let you search months of logs in seconds. They require more setup but are essential in serious production environments.
Log Management Best Practices
Analyzing logs only when something breaks is too late. These practices turn logs into a proactive asset:
- Configure log rotation.
logrotatecomes pre-configured on most distros; make sure logs cannot fill your disk. - Centralize logs if you run multiple servers. Ship them to a dedicated log server or a cloud logging service to maintain full visibility.
- Set up automatic alerts. Configure Logwatch to email you a daily digest, or use a monitoring tool that notifies you when it detects anomalies.
- Retain logs for at least 30 days. Many security incidents are not detected until days after the attack. If your logs rotate every 7 days, you lose critical evidence.
- Protect logs from tampering. The first thing an attacker with server access does is delete or alter logs to cover their tracks.
If you would rather hand off VPS log management to experts, the team at elenlace.com provides server administration services that include continuous monitoring and real-time alerts.
Key Takeaways
- The most important VPS logs for web administrators live in
/var/log/:auth.log,syslog,access.log, anderror.log. tail -fandgrepare your immediate diagnostic tools; GoAccess and Logwatch provide deeper analysis.- In
auth.log, look for successful logins from unknown IPs; inaccess.log, watch for 4xx/5xx error spikes and scanning patterns. - Configure automatic rotation so logs do not fill your disk, and retain at least 30 days of history.
- Logs are forensic evidence: protect them from tampering and centralize them if you can.
Reviewing your logs regularly is the difference between catching a problem in minutes and finding out from angry users hours later. If you want professional monitoring without managing the infrastructure yourself, get in touch at elenlace.com.
FAQ
How often should I check my VPS logs?
At a minimum, set up Logwatch to send you a daily email digest. Whenever an incident occurs — downtime, slowness, odd behavior — check the relevant log in real time with tail -f before making any other changes.
What do I do if logs are filling up my disk?
First, free space by removing very old compressed logs (find /var/log -name "*.gz" -mtime +60 -delete). Then adjust your logrotate configuration to rotate more frequently or compress sooner. Also check whether any service is generating error logs in a tight loop.
Can I see PHP errors from the Nginx log?
Nginx delegates PHP execution to PHP-FPM. PHP errors are logged according to the error_log directive in php.ini, or in Nginx's own error.log if PHP-FPM is configured to redirect them there. Check both places.
Do my VPS logs include WordPress logs?
WordPress can maintain its own debug log at wp-content/debug.log when debug mode is enabled in wp-config.php. PHP errors from WordPress also appear in the web server's error.log. To enable WordPress logging, add: define('WP_DEBUG', true); define('WP_DEBUG_LOG', true); to wp-config.php.
Further reading
Other providers and guides worth comparing: