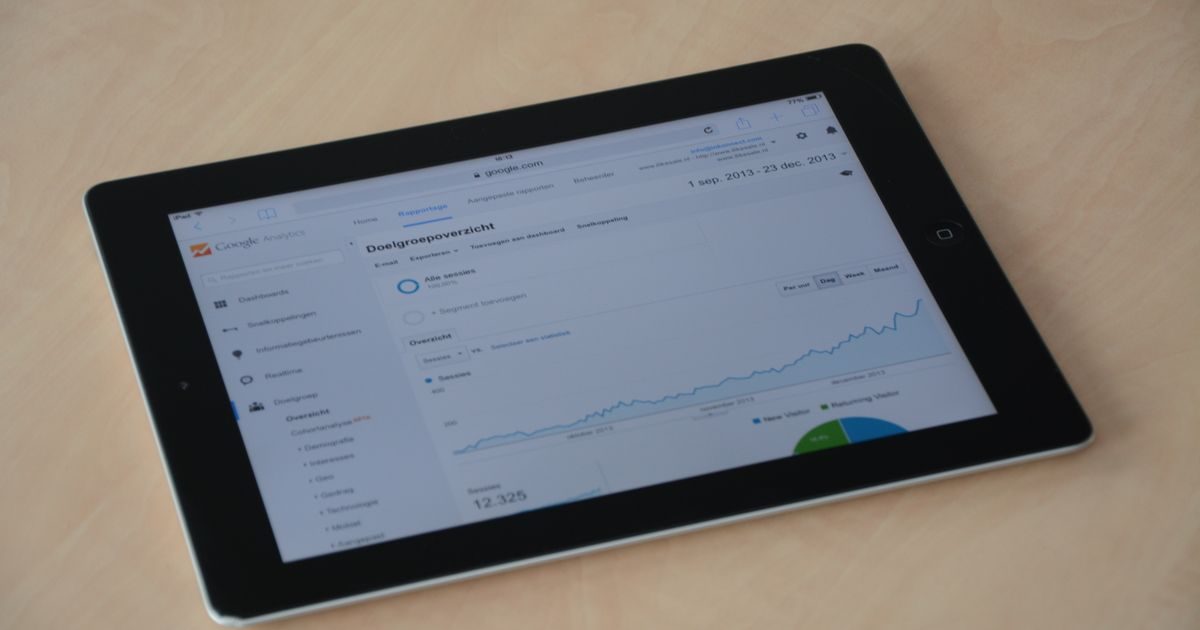
Page speed measures how long it takes for a page to appear in the browser; web performance is a broader concept that covers that speed plus interactivity, visual stability, and the quality of the entire user experience. Confusing the two leads teams to optimize metrics that don't actually move the needle.
Understanding the difference helps you prioritize better, communicate more precisely with your technical team, and make improvements that benefit both users and SEO.
What Is Page Speed and What Does It Measure
When someone casually says "page speed," they usually mean the time between clicking a link and seeing something on screen. Historically this was measured with metrics like Page Load Time (the browser's load event) or DOMContentLoaded.
The problem with these classic metrics is that they don't reflect the user's real perception. A page can fire the load event in 800 ms but still be loading images and scripts for 5 more seconds while the user tries to interact with it.
The modern visual speed metrics that actually matter are:
- FCP (First Contentful Paint): first visible text or image. Good threshold: ≤ 1.8 s.
- LCP (Largest Contentful Paint): main visible element (hero, featured image). Good threshold: ≤ 2.5 s.
- Speed Index: how quickly the screen fills up visually. Good threshold: ≤ 3.4 s.
What Is Web Performance and Why It Is Broader
Web performance encompasses all of the above plus dimensions that visual speed alone doesn't capture:
- Interactivity: can the user click, type, or scroll without the page freezing? Key metric: INP (Interaction to Next Paint, ≤ 200 ms).
- Visual stability: do elements jump or shift while the page loads? Key metric: CLS (Cumulative Layout Shift, ≤ 0.1).
- Reliability: does the page work correctly on slow connections, mid-range devices, and without JavaScript enabled?
- Perceived performance: a user may feel a page is "fast" even if it takes 3 seconds, if the visual feedback is right (skeleton screens, spinners, progress indicators).
In other words: you can have a page that loads visually fast (good FCP and LCP) but feels frustrating because buttons are slow to respond (high INP) or because the layout jumps just as you're about to click something (high CLS). That site has good page speed but poor web performance.
The Table That Clears It All Up
| Dimension | Page Speed | Web Performance |
|---|---|---|
| Scope | Visual: how fast does it appear? | Complete: how well does it work? |
| Main metrics | FCP, LCP, Speed Index, TTFB | LCP, INP, CLS (Core Web Vitals) + all of the above |
| What it measures | Time to visible content | Time + interactivity + stability + perception |
| Direct SEO impact | Partial (LCP contributes) | Full (all three Core Web Vitals are ranking signals) |
| Reference tool | GTmetrix, WebPageTest | PageSpeed Insights, Chrome UX Report |
Why the Distinction Matters in Practice
Many teams optimize page speed — compress images, minify CSS — and then get frustrated when rankings don't improve. The most common reason is that Core Web Vitals, especially INP and CLS, remain in the red in field data even though the Lighthouse score went up.
Google uses real field data (Chrome User Experience Report) as a ranking signal, not lab data. A real user on a mid-range phone with a 4G signal experiences your page in a way no lab tool perfectly replicates.
Some practical takeaways:
- Reducing image weight improves page speed but won't fix a high INP caused by heavy JavaScript on the main thread.
- Reserving space for images and ads with explicit dimensions improves web performance (lowers CLS) without necessarily making the page visually faster.
- A high TTFB hurts both: it delays everything that follows and is the first sign of server or network problems.
If you'd like a complete audit of your metrics, the specialists at elenlace.com can give you a separate diagnosis for speed and performance.
How to Improve Each Dimension Separately
To improve page load speed (visual)
- Optimize and convert images to WebP or AVIF.
- Apply lazy loading to content below the fold.
- Use a CDN to bring assets closer to users.
- Enable Gzip or Brotli compression on the server.
- Remove render-blocking resources (non-critical CSS and JS in the
<head>).
To improve overall web performance
- INP: reduce long tasks on the main thread (split JS bundles, use
requestIdleCallback, avoid heavy synchronous event listeners). - CLS: reserve space with explicit
width/heightoraspect-ratioon images and ad containers; avoid injecting content above already-rendered elements. - Perceived performance: show skeleton screens or spinners during loading; users perceive waits as shorter when there's visual feedback.
You can dive deeper into all these optimizations in the web performance articles section of this blog.
Key Takeaways
- Page speed and web performance are not synonyms: the former measures how quickly something appears; the latter covers interactivity, stability, and the full user experience.
- The Core Web Vitals (LCP, INP, CLS) are the performance signal Google uses for ranking — they go beyond visual speed.
- Optimizing only images and page weight can improve speed without moving real web performance or SEO.
- Field data (CrUX) is more valuable than lab data for understanding what your users actually experience.
- A complete optimization strategy must address visual speed, interactivity, and stability in parallel.
Want to know exactly where your site is falling short? Get in touch at elenlace.com and we'll run a speed and performance diagnosis together at no cost.
FAQ
Does a high PageSpeed Insights score guarantee good web performance?
No. The PageSpeed Insights score is a lab approximation. Real performance depends on field data (CrUX): if your Core Web Vitals are in the red in field data, performance is bad for your users even if the lab score says 90.
Which metric matters most for SEO?
The three Core Web Vitals measured in the field: LCP, INP, and CLS. Google uses real user data for its Page Experience ranking signal, not the Lighthouse lab score.
Is Time to First Byte (TTFB) page speed or web performance?
It belongs to both dimensions: it's the foundation of the entire chain. If the server takes more than 800 ms to respond, everything else — FCP, LCP, INP — suffers as a result. It's the first thing to fix if it's above threshold.
Can I improve web performance without touching the code?
Partly. Switching to faster hosting or enabling a CDN improves TTFB and LCP without code changes. But high INP or CLS problems generally require adjustments to CSS, JavaScript, or the HTML structure of the page.
Compare providers
Other providers and guides worth comparing: