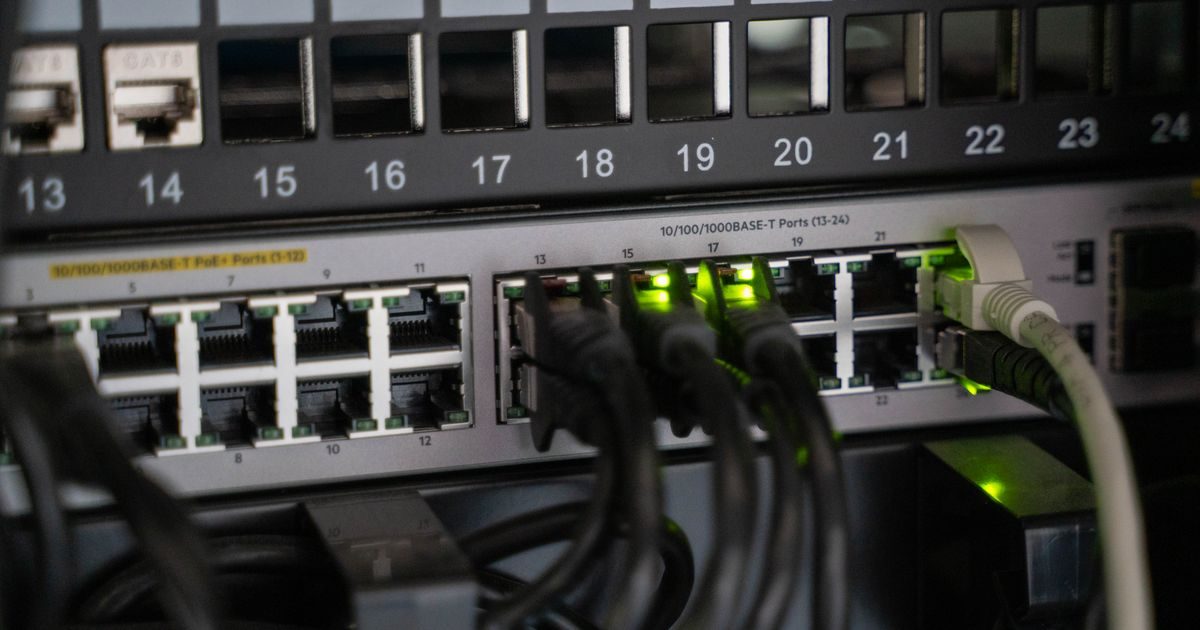
To monitor VPS performance, focus on four key metrics: CPU usage, RAM consumption, disk activity, and network traffic. Native Linux commands give you a full picture in seconds, while continuous monitoring tools alert you before a problem brings your site down.
This guide covers everything from basic one-off commands to real-time monitoring solutions, all applicable to any VPS running Ubuntu, Debian, or CentOS/AlmaLinux.
The Four Metrics That Matter
Understanding what to measure before opening any tool will save you time during incidents:
- CPU — sustained usage above 80 % signals a saturated server or a runaway process.
- RAM — when available memory drops and the system starts swapping, performance falls off a cliff.
- Disk I/O — databases and high-traffic sites are sensitive to read/write bottlenecks.
- Network — unexpected traffic spikes can indicate DDoS attacks or misconfigured processes.
For help choosing the right VPS plan for your workload, browse the VPS servers guide.
Native Linux Tools
You don't need to install anything extra to get started. The following commands are available on most distributions out of the box.
top and htop — Real-Time CPU and RAM
top comes pre-installed and lists processes sorted by CPU consumption. htop adds a friendlier interface with color bars:
# Install htop if not available
apt install htop -y   # Debian/Ubuntu
dnf install htop -y   # RHEL/AlmaLinux

htop
The most useful columns are %CPU, %MEM, and RES (physical RAM used by each process). Press F6 to sort by any column.
free — RAM and Swap Usage
free -hThe available column shows memory truly available for new processes — far more useful than the raw free column. If swap used is consistently above zero, your VPS needs more RAM or a process has a memory leak.
df and du — Disk Space
df -h          # free space per partition
du -sh /var/*  # which folder is consuming the most space
A disk at 100 % stops databases, web servers, and logging dead in their tracks. Set an alert at 80 % occupancy.
iostat — Disk I/O Performance
apt install sysstat -y
iostat -xz 1 5   # 5 samples, 1 second apart
Watch the %util column: if it stays above 80 % consistently, the disk is the bottleneck. Consider migrating to NVMe storage or adding a caching layer.
vmstat — System-Wide Summary
vmstat 2 10 # 10 samples, 2 seconds apartThe wa column (I/O wait) shows how long the CPU spends waiting for disk operations. Persistently high values confirm an I/O problem.
ss and netstat — Network Connections
ss -tuln          # listening ports
ss -s             # connection summary
netstat -an | grep ESTABLISHED | wc -l   # total established connections
An abnormally high number of connections in TIME_WAIT or SYN_RECV state can indicate an attack or a misconfiguration in your web server.
Quick Reference Table
| Metric | Command | Alert Threshold |
|---|---|---|
| CPU | htop / top |
>80 % sustained for >5 min |
| Available RAM | free -h |
<10 % of total |
| Swap used | free -h |
Any consistent usage |
| Disk | df -h |
>80 % occupancy |
| I/O wait | vmstat / iostat |
wa >20 % sustained |
| Network | ss -s |
Sudden connection spikes |
Continuous Monitoring and Alerts
The commands above are excellent for point-in-time diagnostics, but they won't wake you up when something fails at 3 AM. For that you need a continuous monitoring solution.
Netdata — Real-Time Dashboard, Free
Netdata installs in a single command and exposes a web dashboard with hundreds of metrics updated per second:
wget -O /tmp/netdata-kickstart.sh https://get.netdata.cloud/kickstart.sh
sh /tmp/netdata-kickstart.sh
Access it from your browser at http://YOUR_IP:19999. Configure email or Telegram alerts by editing /etc/netdata/health_alarm_notify.conf.
Glances — All-in-One Terminal Monitor
pip3 install glances
glances
Glances displays CPU, RAM, disk, network, and processes on a single terminal screen. Ideal for SSH sessions where you don't want to set up an additional web server.
Uptime Kuma — External Monitoring
Netdata and Glances monitor from inside the server. To know whether your site responds from the outside world, Uptime Kuma (self-hosted) or external services like Better Uptime check your URL every minute and notify you via Telegram or email if it goes down.
Monitoring Best Practices
- Establish baselines — note normal CPU/RAM usage during peak and off-peak hours. Alerts without context generate noise.
- Store historical data — enable
sysstatto record metrics over time so you can analyze trends. - Monitor the application, not just the OS — slowness in MySQL or PHP-FPM may not surface in system-level metrics until it's too late.
- Check error logs first —
/var/log/syslog,/var/log/nginx/error.log, and/var/log/mysql/error.logare your first diagnostic sources.
Need help setting up a complete monitoring stack for your VPS? The team at elenlace.com provides technical support for VPS servers in Mexico.
Key Takeaways
- CPU, RAM, disk, and network are the four fundamental VPS performance metrics.
htop,free -h,df -h,iostat, andvmstatcover immediate diagnostics with no extra installs.- Set clear alert thresholds: CPU >80 %, available RAM <10 %, disk >80 %.
- Netdata delivers free, real-time continuous monitoring with configurable alerts.
- Combine internal monitoring (Netdata/Glances) with external monitoring (Uptime Kuma) for full coverage.
- Error logs are always the first place to look when something goes wrong.
FAQ
How often should I check my VPS performance?
With a continuous monitoring tool like Netdata, manual checks are only needed when an alert fires or you notice slowness. Without automated monitoring, review metrics at least once daily on production servers.
Why does my VPS use a lot of RAM with no apparent load?
Linux uses spare RAM as a disk cache to speed up future reads — this is normal and desirable. What matters is the available column in free -h, not free. If available is very low and the system is using swap, then there's a real problem.
Does Netdata impact VPS performance?
Its footprint is minimal — typically under 1 % CPU and 50–100 MB of RAM. On VPS plans with 1 GB or less it may be noticeable; in those cases use Glances, which has a lighter profile.
How do I know if the problem is the database rather than the server?
Log into MySQL and run SHOW PROCESSLIST; to see active queries. If queries are blocked or taking several seconds, the bottleneck is in the database layer, not in OS-level resources.
Prefer it done for you? El Enlace handles hosting and professional web development.
Useful resources
Other providers and guides worth comparing: